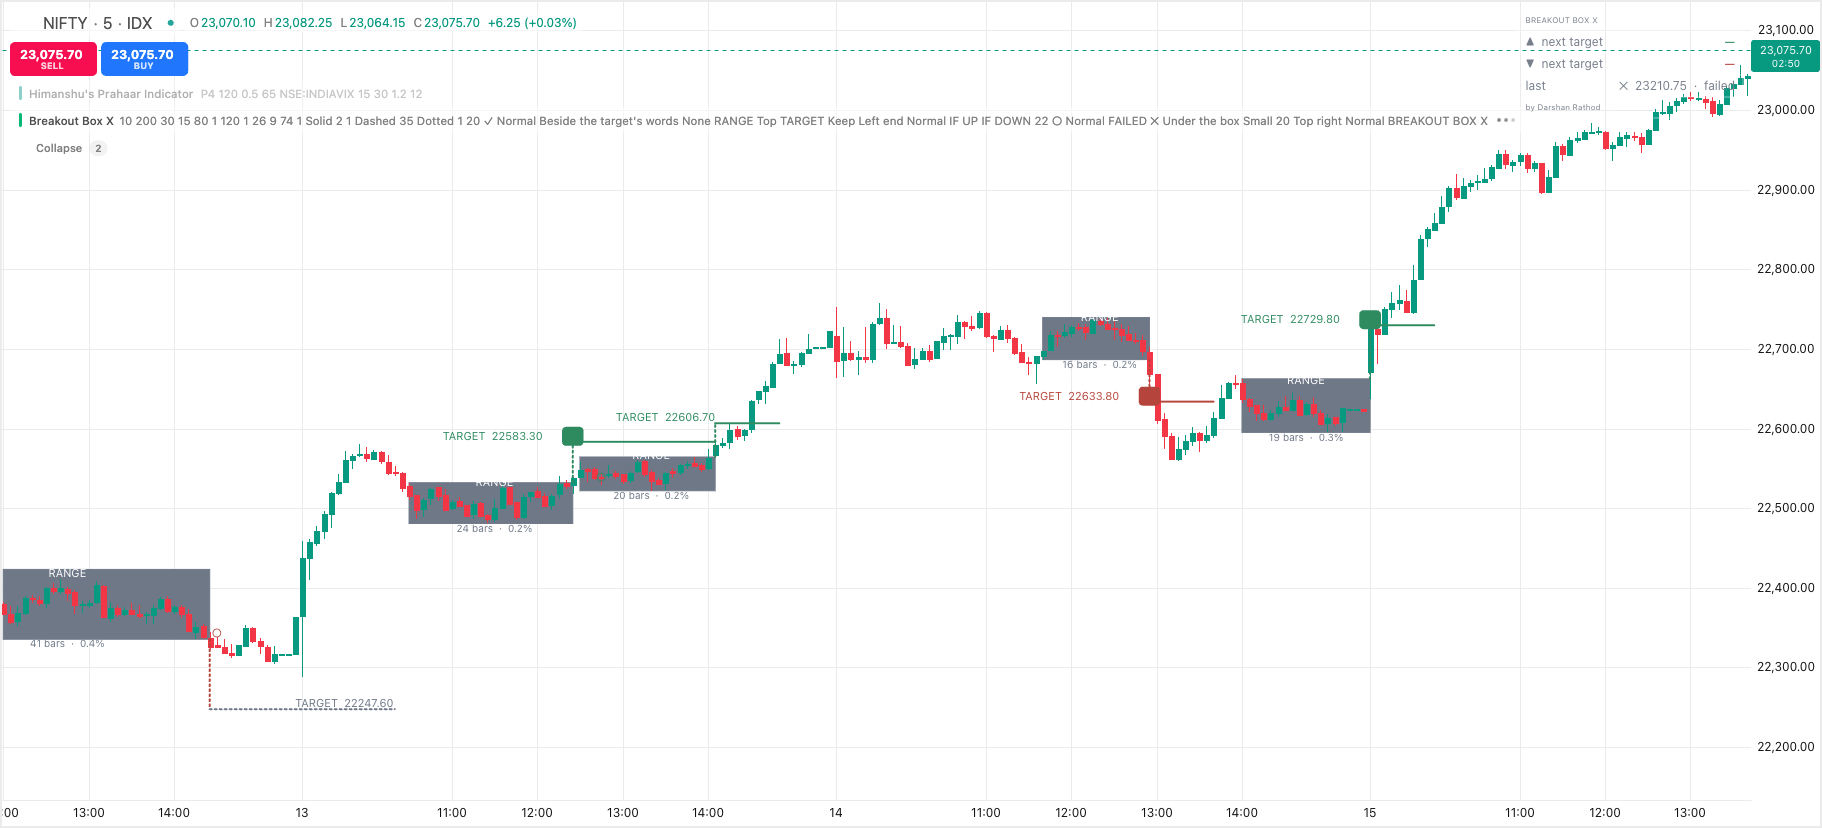
Breakout Box X indicator
Spot the Range. Catch the Breakout. Track the Target.
by Darshan Rathod  Premium
₹ 399 / month

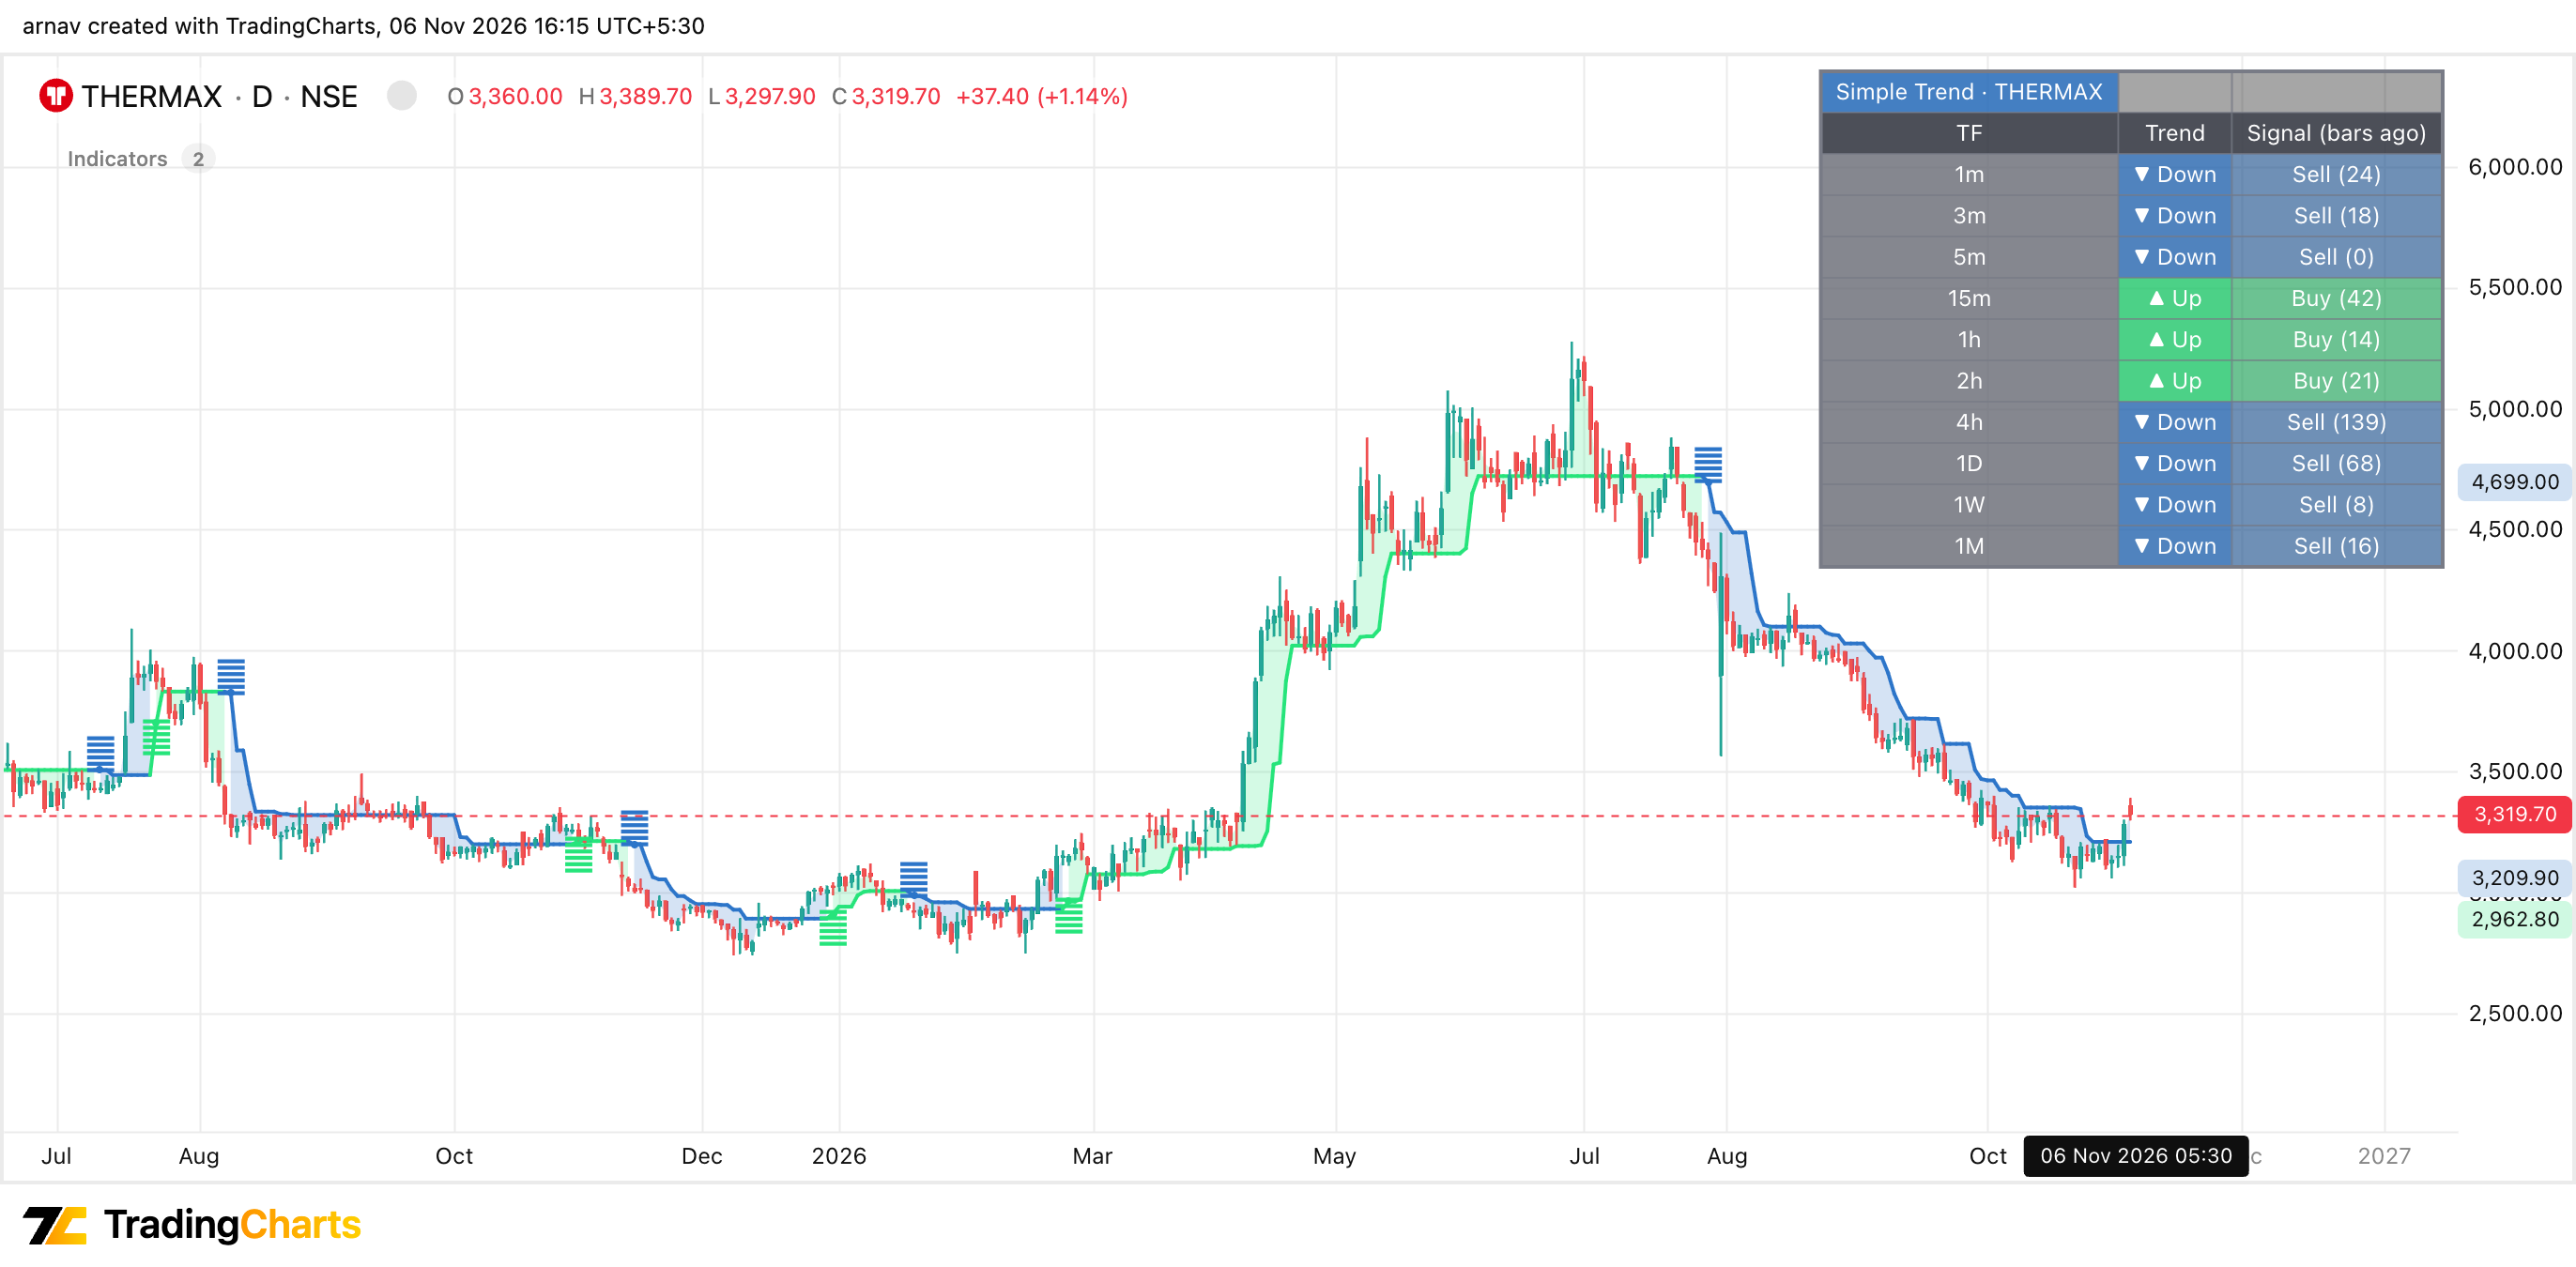
Simple Trend helps traders easily identify market trends and possible buy and sell opportunities. The indicator is easy to use, fully customizable, and helps traders understand market direction at a glance.
Shows market trends, buy/sell signals, and how many candles ago the last signal appeared across different timeframes.
Track changes in market direction with a visual trend line.
Adjust trend sensitivity, signal size, colors, and dashboard preferences.
Option to use confirmed bars for more stable signals and reduced repainting in the multi-timeframe dashboard.

Spot the Range. Catch the Breakout. Track the Target.
PremiumIdentify market direction with clear trade signals, a dynamic trend ribbon, and pullback analysis.
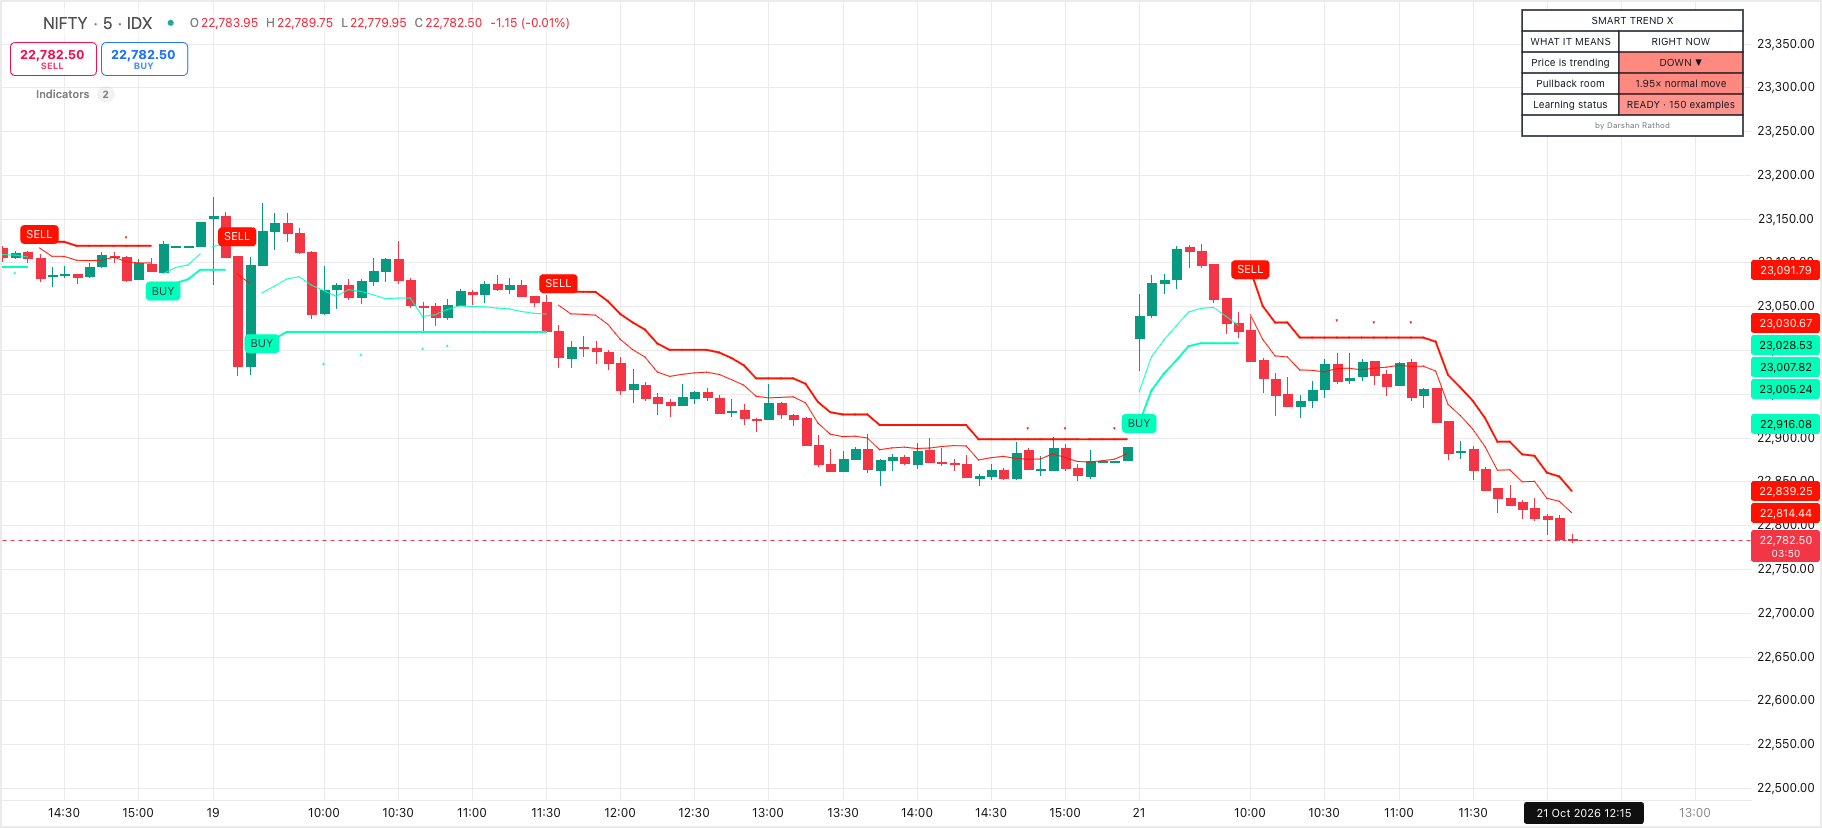
Long and Short signals only when the trend engine and the Heikin Ashi candles agree.
Premium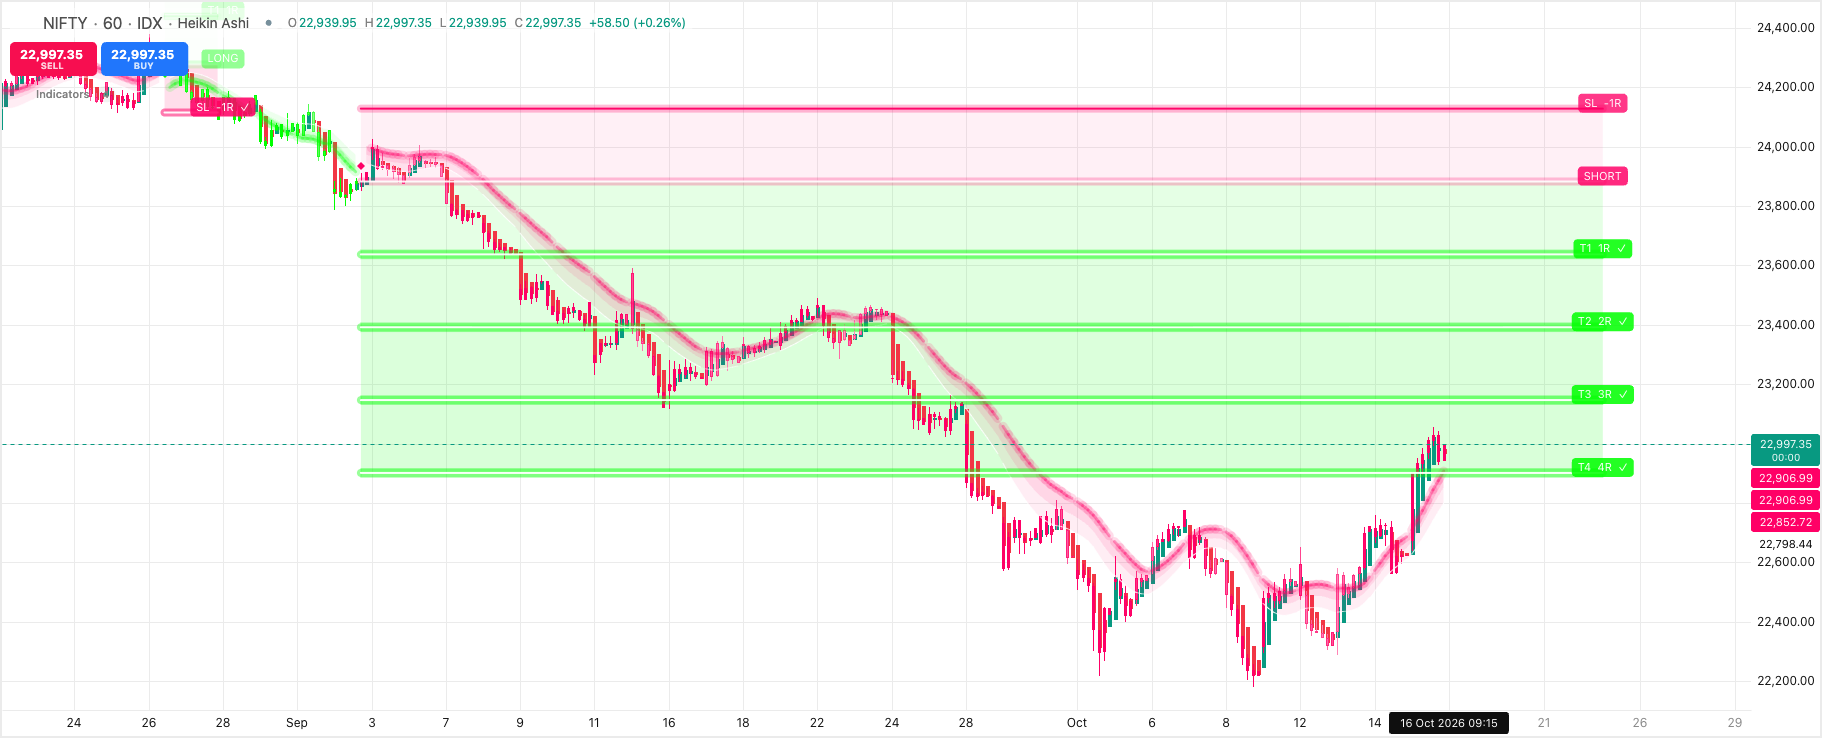
Find stronger stocks for long-term investing with Wealth Radar