Smart Trend X indicator
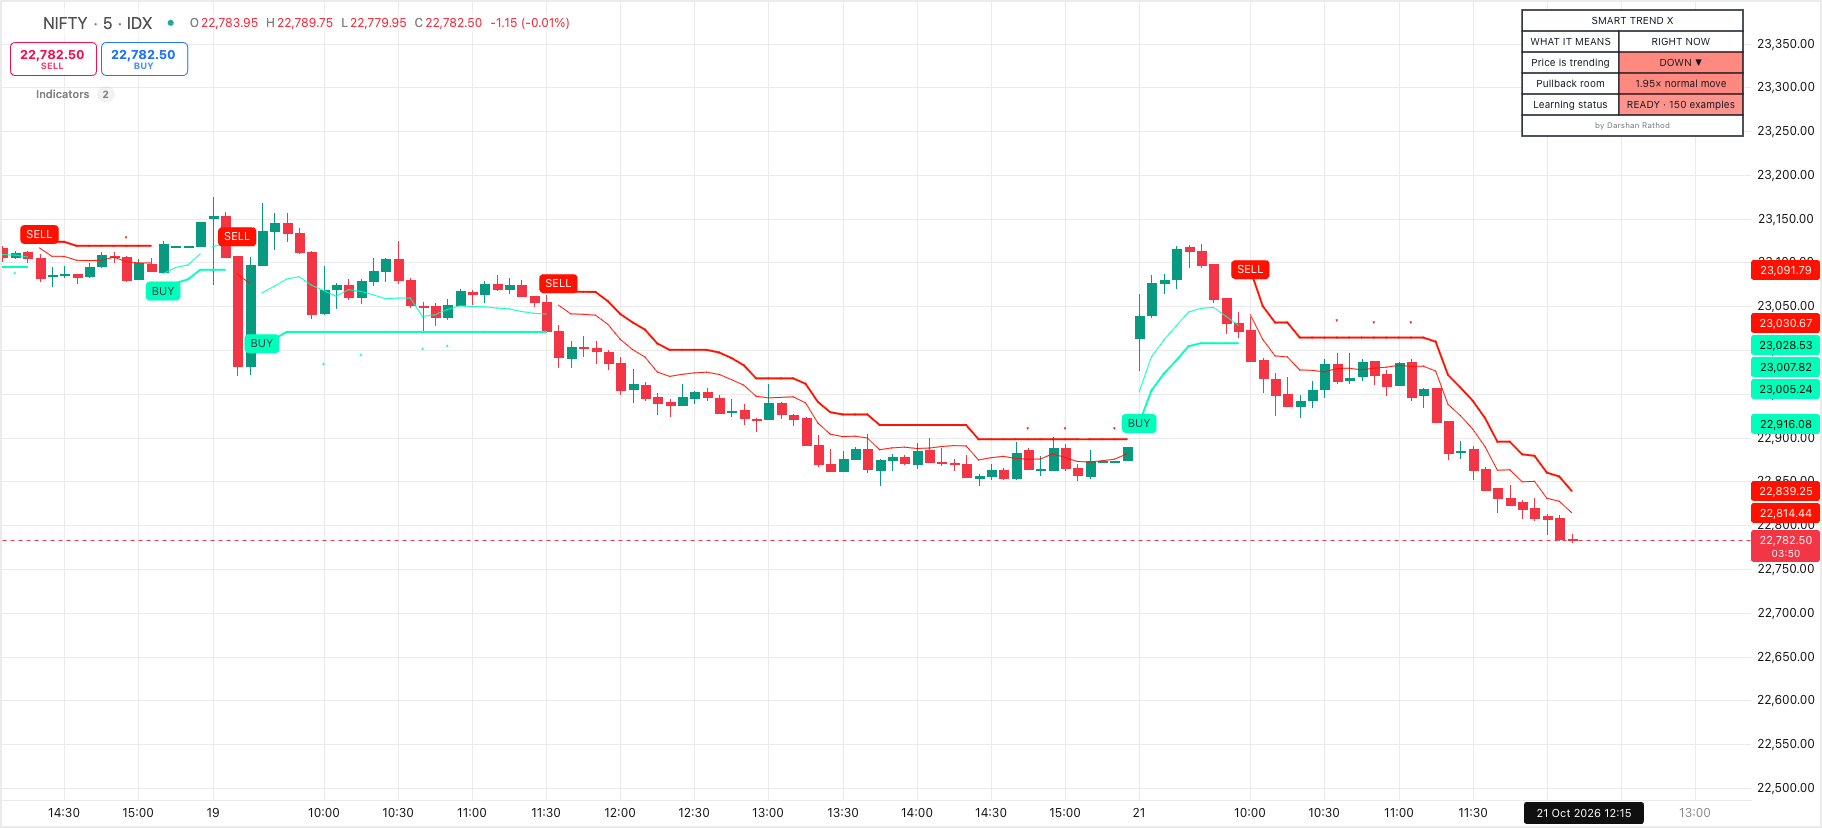
Identify market direction with clear trade signals, a dynamic trend ribbon, and pullback analysis.
₹ 399 / month34% OFF₹600

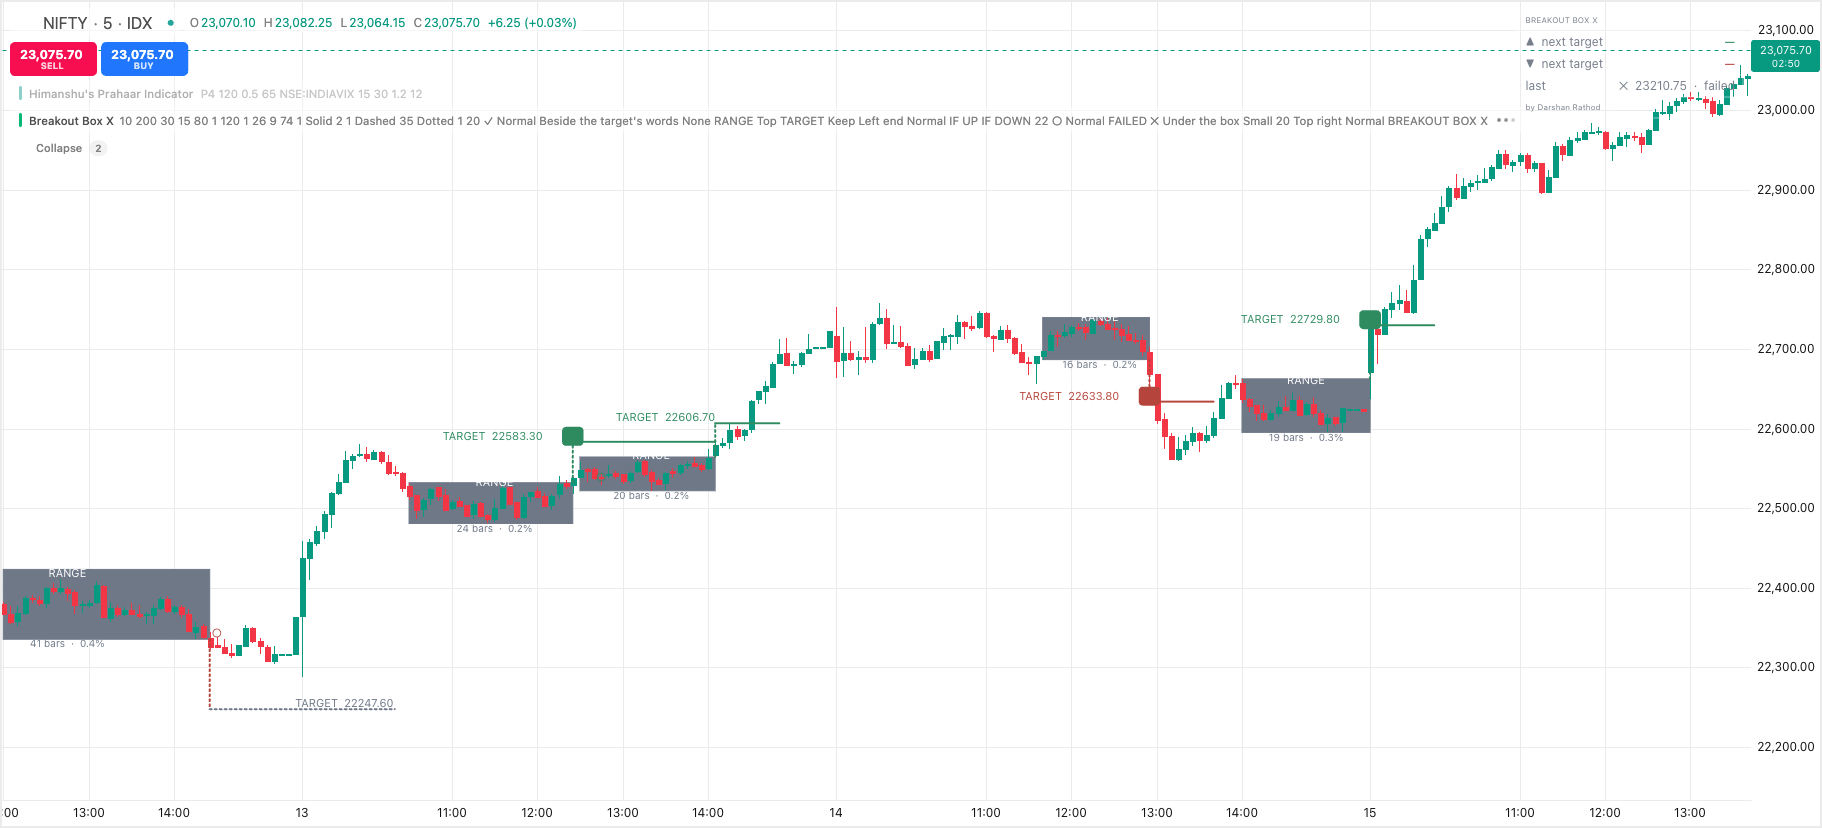
Breakout Box X finds tight sideways ranges where the market is building up energy, and draws a box around each one. When price breaks out, it automatically draws a target, tracks it, and ticks it ✓ when price reaches it.
Identifies tight consolidation zones and draws boxes around them.
Highlights potential long and short setups when a candle closes beyond the range.
Displays “IF UP” and “IF DOWN” levels to help plan both scenarios in advance.
Shows the duration and percentage height of each consolidation range.

Identify market direction with clear trade signals, a dynamic trend ribbon, and pullback analysis.
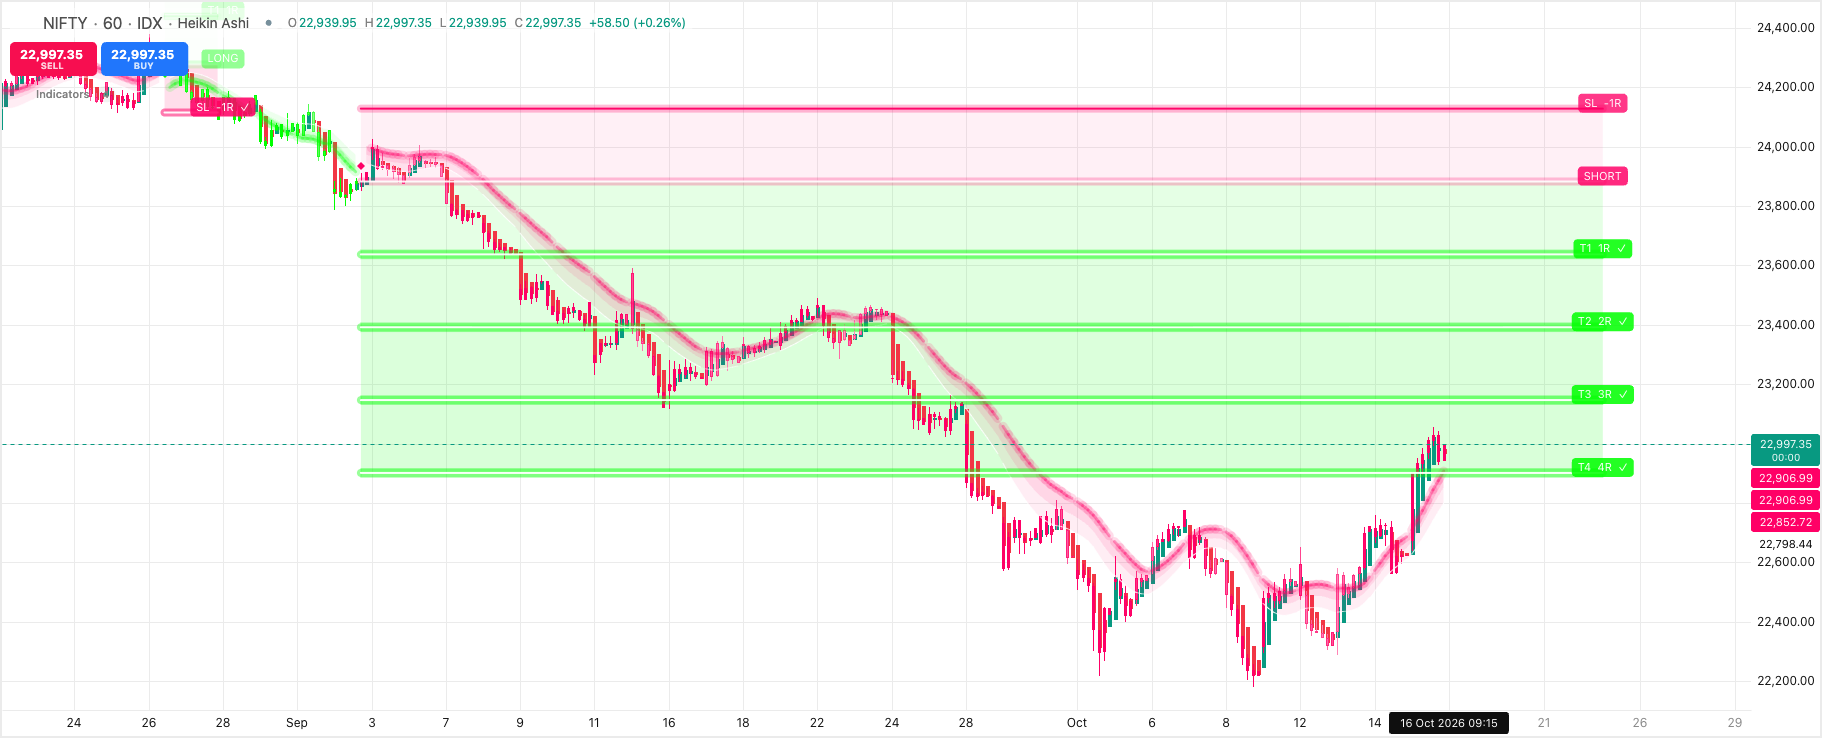
Long and Short signals only when the trend engine and the Heikin Ashi candles agree.
 Premium
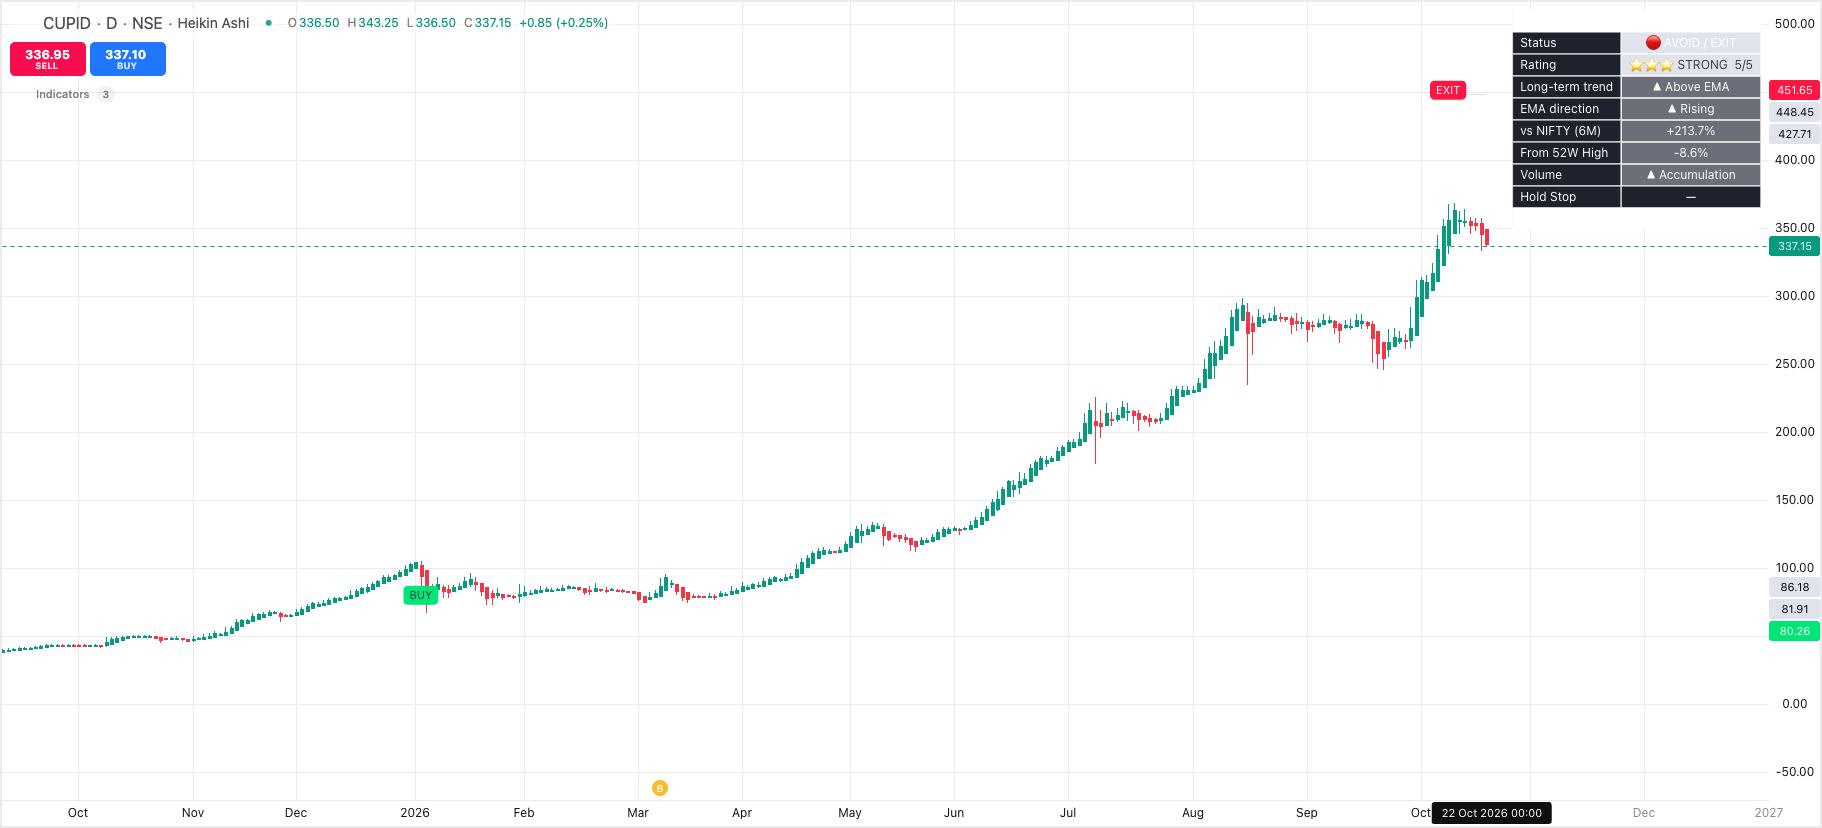
Find stronger stocks for long-term investing with Wealth Radar