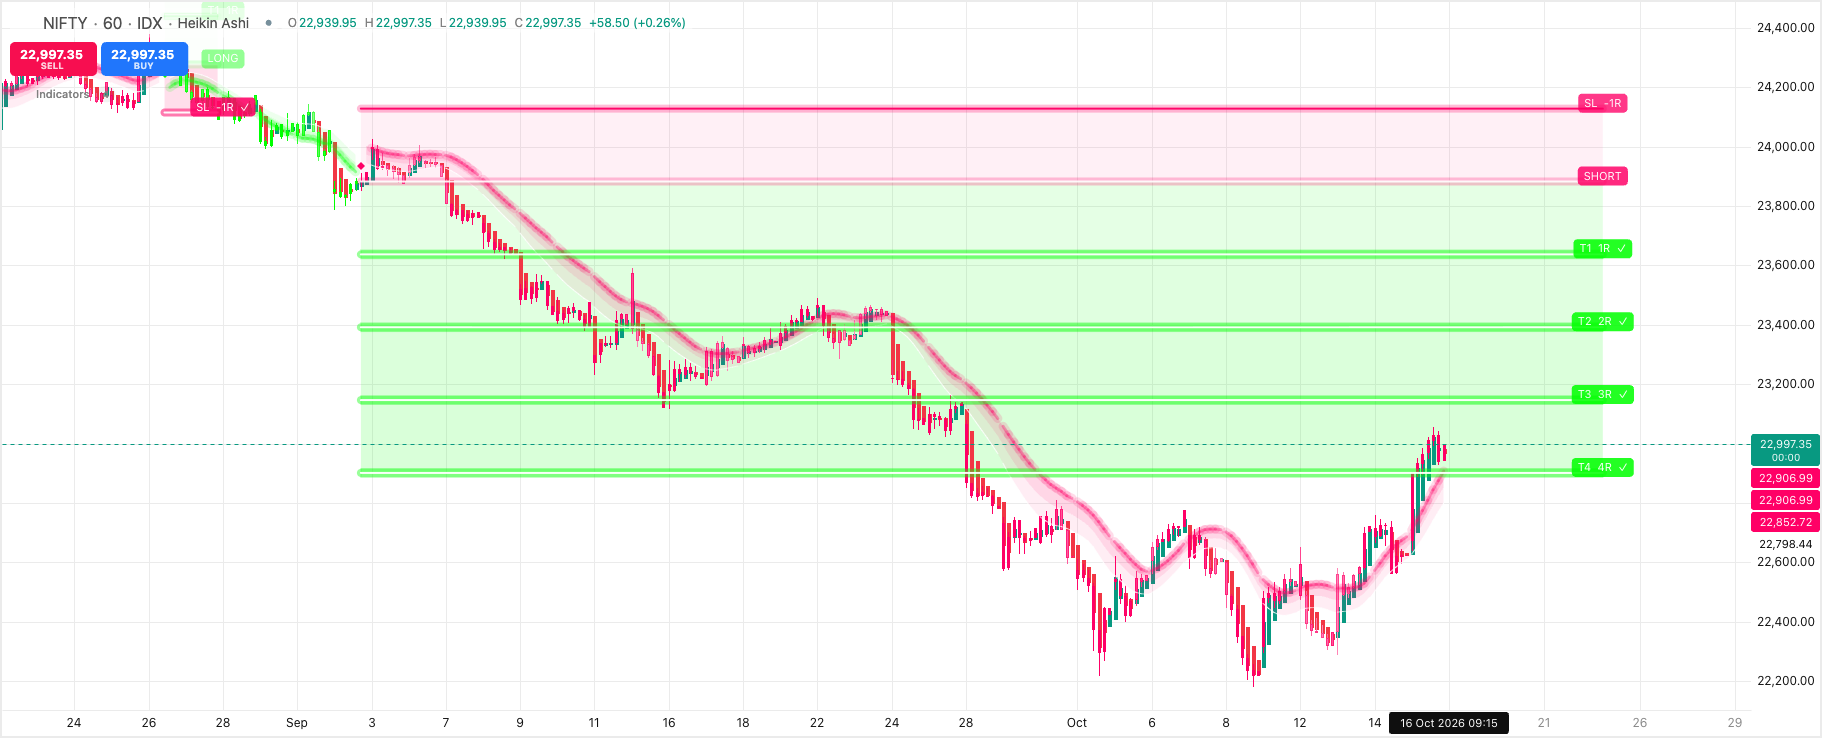
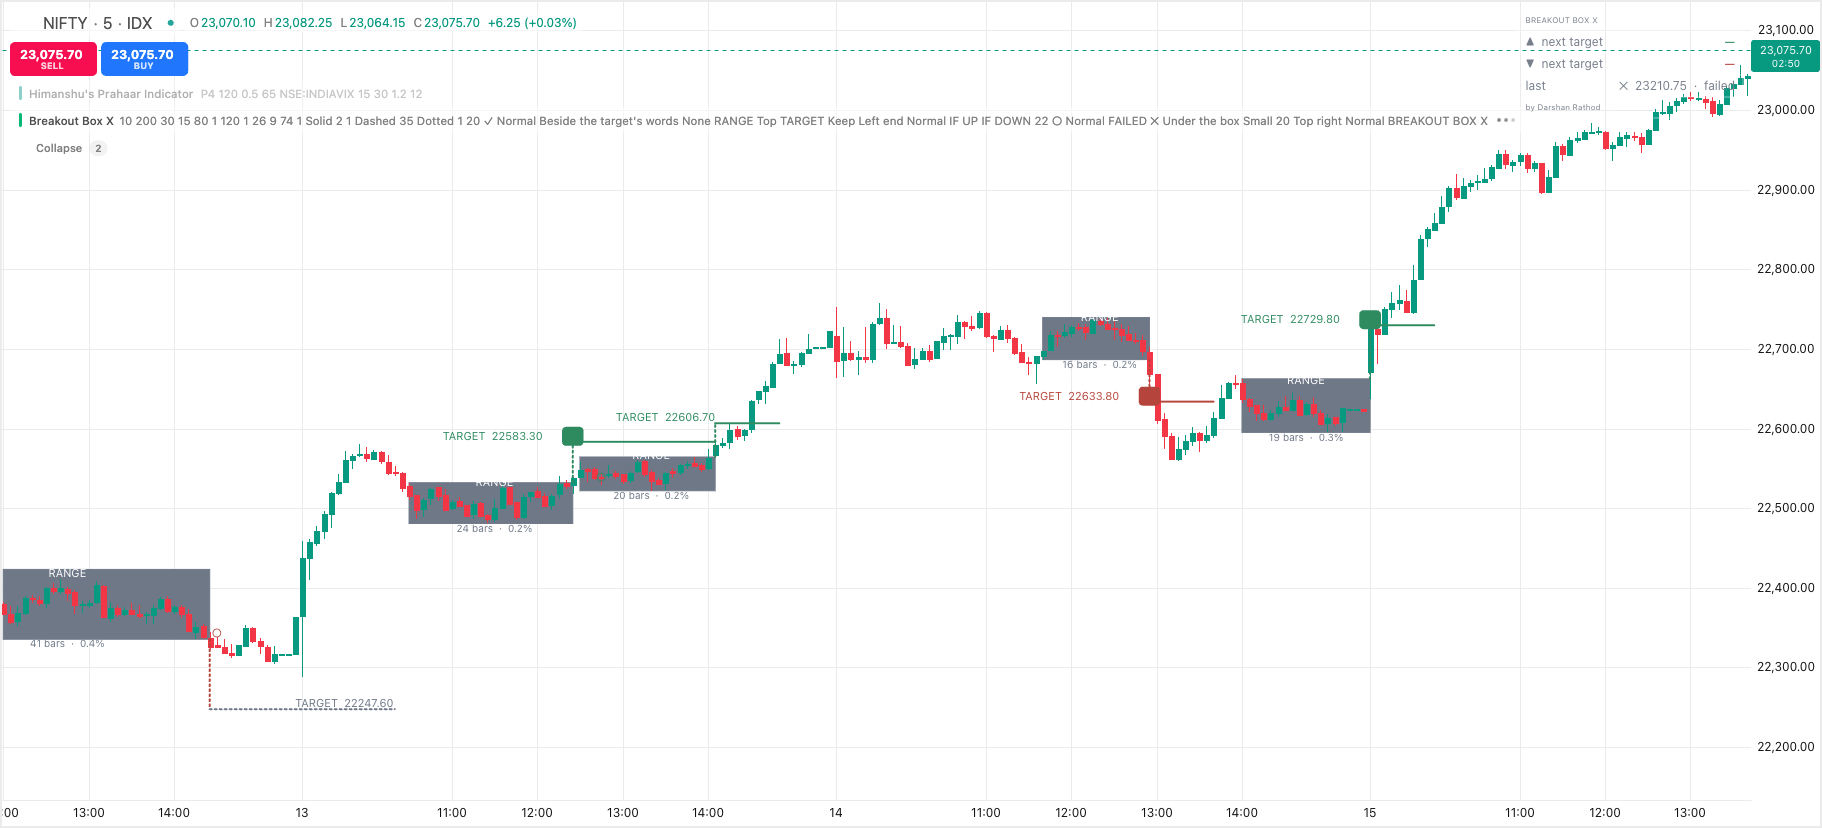
Breakout Box X indicator
Spot the Range. Catch the Breakout. Track the Target.
by Darshan Rathod  Premium
₹ 399 / month

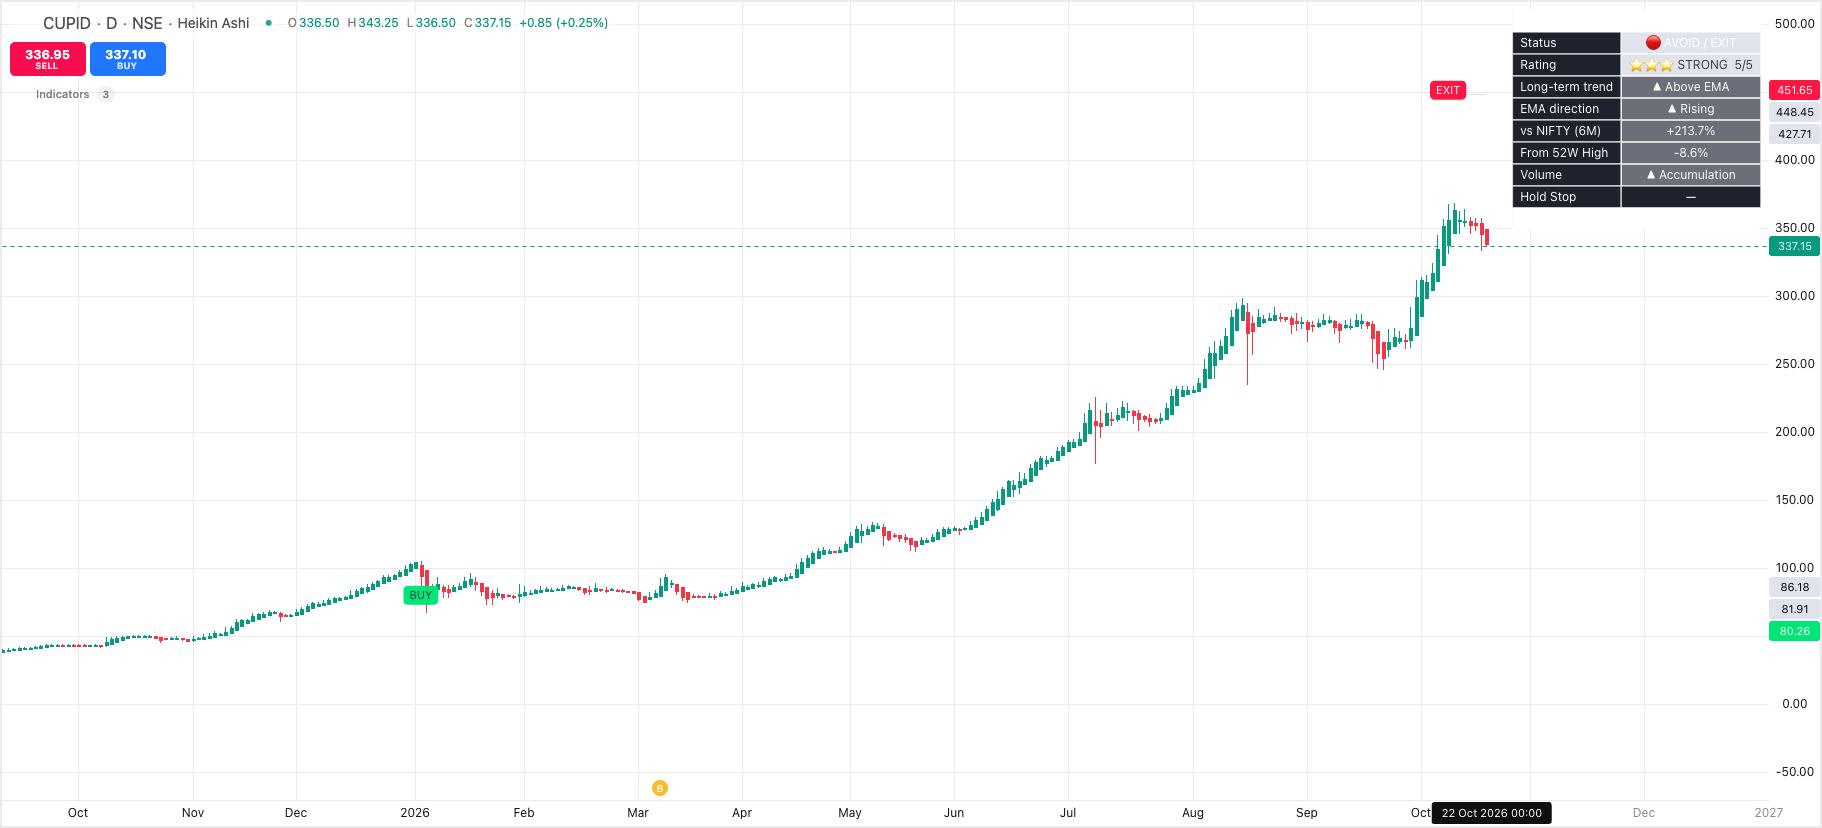
Get BUY and EXIT signals, assess stock strength against NIFTY 50, and track trends with a dynamic trailing stop and an easy-to-read stock health dashboard.
Identify potential trend reversals using directional price bands.
Evaluate stocks based on long-term trend, EMA direction, relative performance, proximity to the 52-week high, and volume trends.
View trend status, strength rating, benchmark performance, volume conditions, and trailing-stop information in one place.
Adjust reversal bands, trail behaviour, visual elements, and stock quality filters.

Spot the Range. Catch the Breakout. Track the Target.
PremiumIdentify market direction with clear trade signals, a dynamic trend ribbon, and pullback analysis.
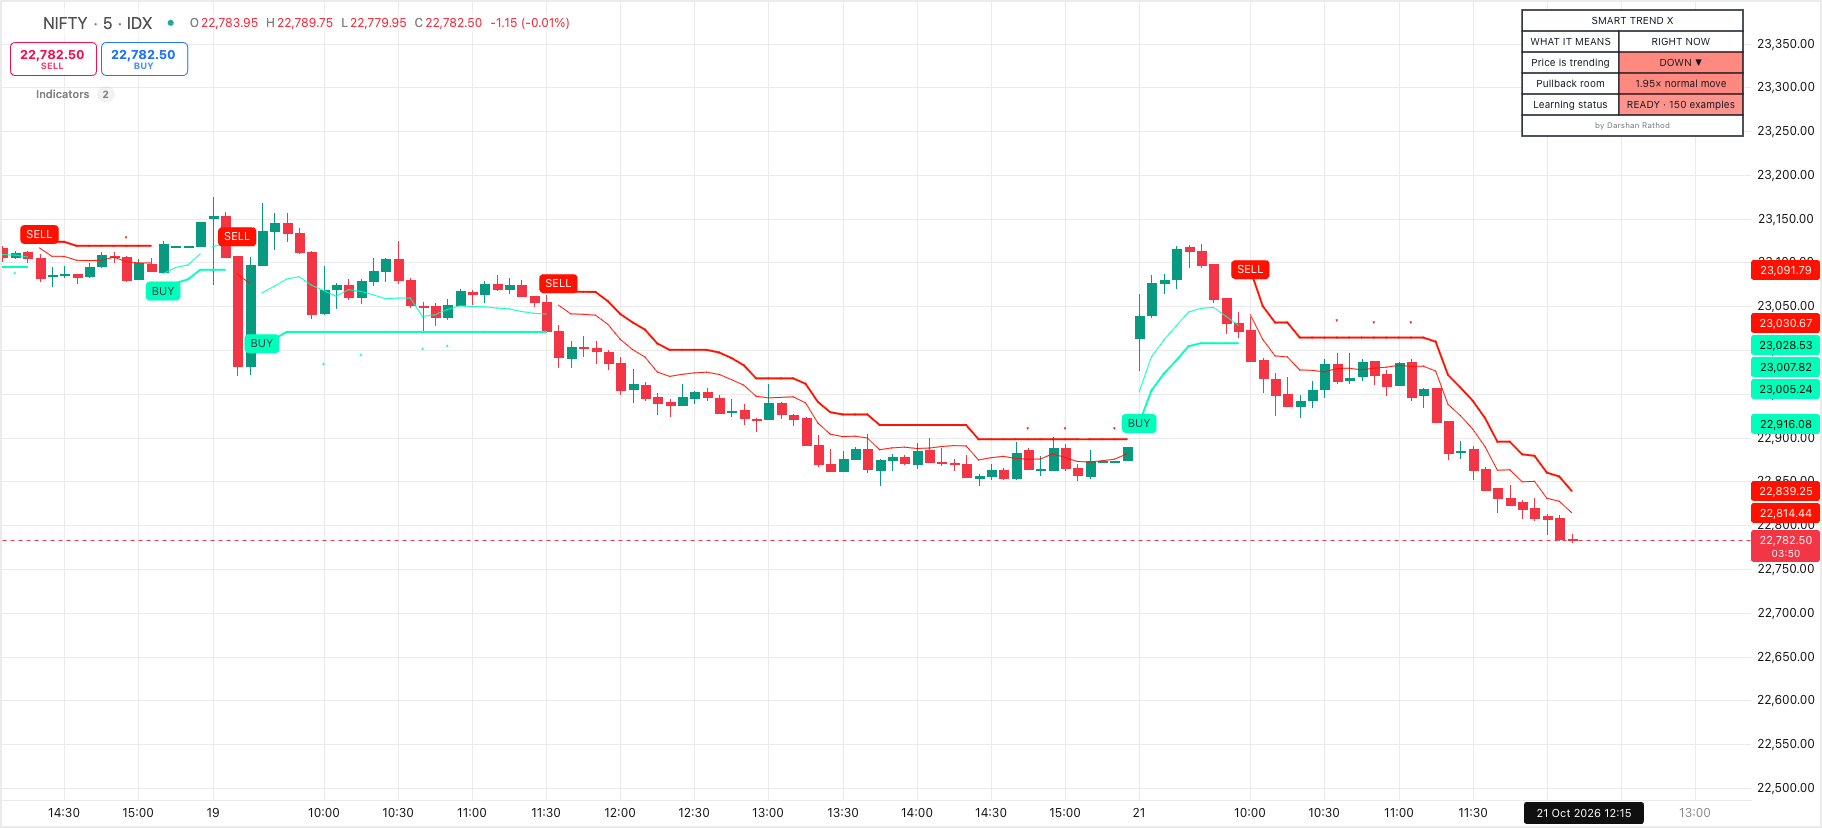
Long and Short signals only when the trend engine and the Heikin Ashi candles agree.
Premium