

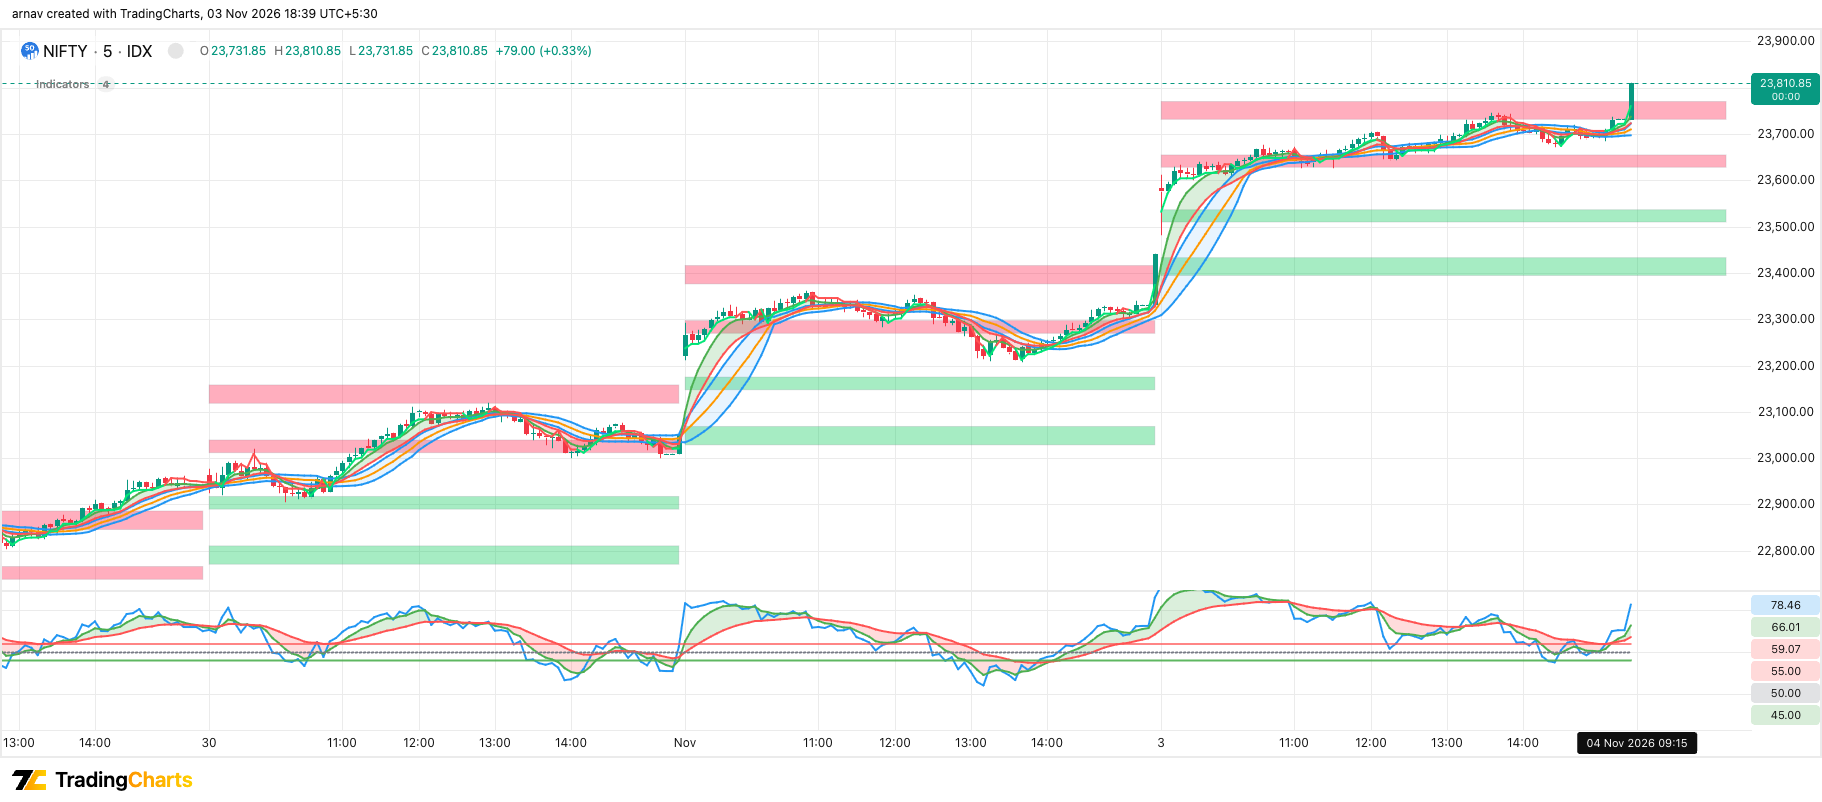
What it does
RK Bhagyavidhata is a technical analysis indicator that combines trend-following tools, momentum indicators, volatility bands, and ATR-based daily price zones into a single setup.
ATR-Based Daily Zones
Visualise potential price reaction areas using daily opening prices and the previous day's ATR.
Bollinger Bands
Track price movement relative to a configurable Bollinger Band system. Customise the period, standard deviation multiplier, band colours, and fill settings to suit your charting preferences.
EMA & SuperTrend Trend Analysis
Combine fast and slow EMAs with SuperTrend to assess price direction and potential trend shifts.
RSI & RSI EMA Momentum Analysis
Monitor RSI alongside fast and slow EMAs calculated on RSI.
How traders use it
- The indicator uses the current day's opening price and the previous day's ATR to plot inner and outer zones above and below the open. These zones help traders visualise potential price reaction areas.