


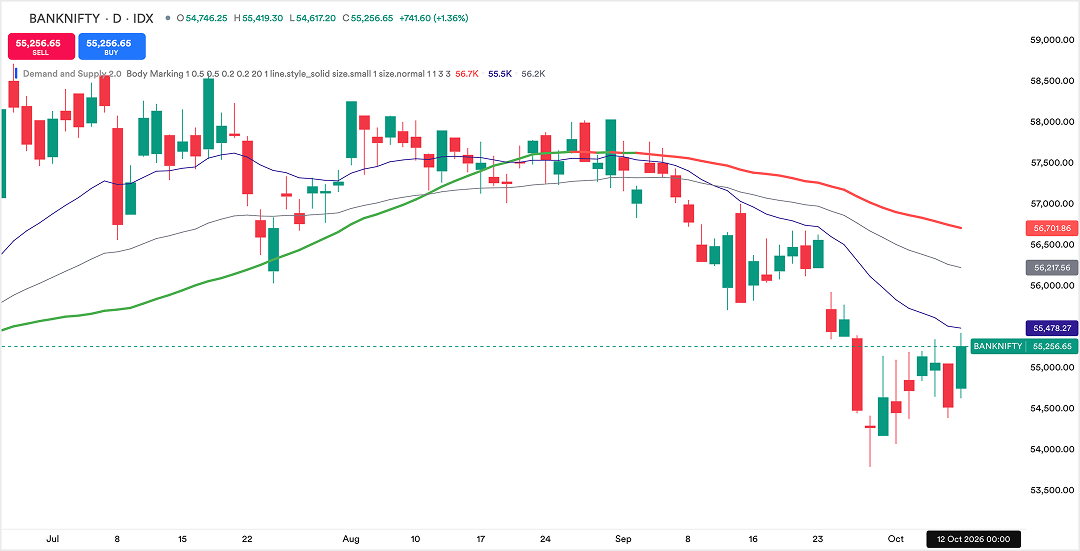
What it does
An advanced Demand & Supply analysis tool designed to help traders identify important price zones, analyse price action, and build a structured trade plan. GTF Indicator automatically analyses price behaviour and visually marks relevant Demand & Supply zones on your chart, helping you spend less time manually searching and marking zones and more time analysing the setup.
Auto Zones
Automatically marks demand and supply zones on the chart, so no manual drawing is needed.
Multi-Timeframe View
Maps key zones across multiple timeframes, showing where the market is most likely to react.
EMA Confluence
Lets you use 20, 50 and 200 EMAs together with trend and volume comparison.
GTF 2.0 Upgrade
Adds higher-precision zones, trend analysis, a smart dashboard and multi-timeframe EMA analysis