

What it does
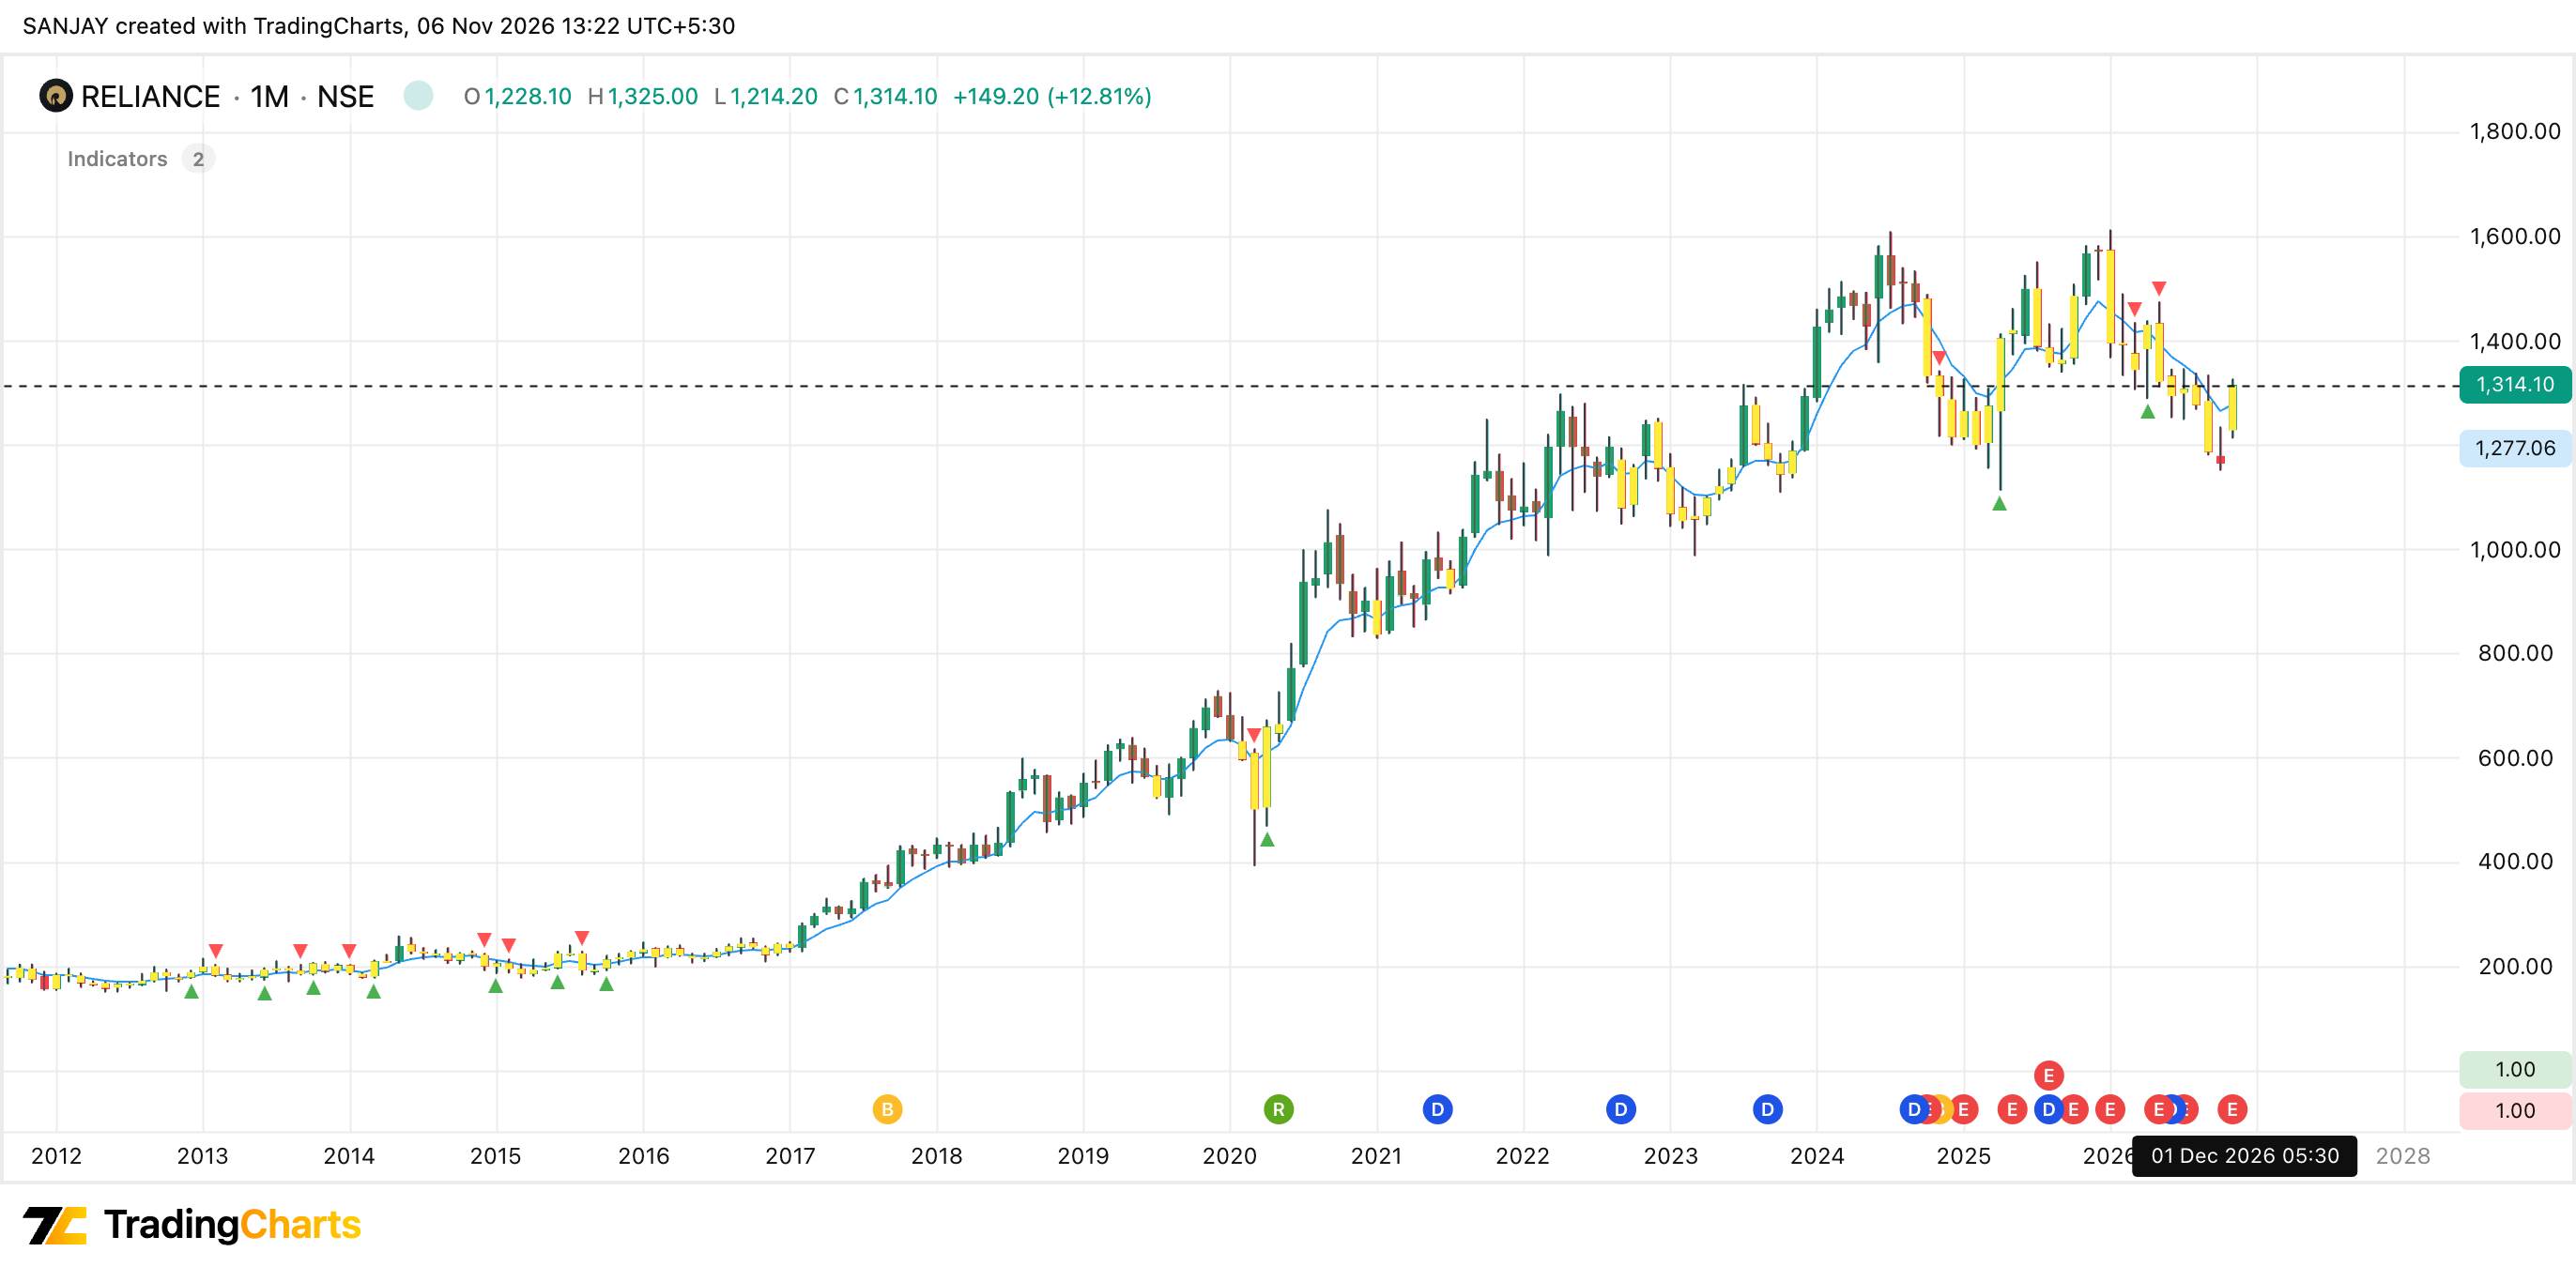
OTD Wealth uses Monthly RSI to identify market momentum and potential trend shifts through colour-coded candles. Track bullish and bearish market conditions with visual Entry and Exit signals based on the RSI 50 level.
Monthly RSI-Based Trend Analysis
Uses a 14-period Monthly RSI to assess broader market momentum and identify changing market conditions across different timeframes.
Five-Zone Candle Colour Coding
Displays candles in five colour-coded momentum zones based on RSI values, ranging from strong bearish (below 20) to strong bullish (above 80).
Automated Entry & Exit Signals
Generates a BUY-style Entry signal when Monthly RSI crosses above 50 and an Exit signal when it crosses below 50, helping identify potential trend transitions.
Multi-Timeframe Market Perspective
Applies Monthly RSI data to the active chart, allowing traders to monitor long-term momentum conditions even when analysing shorter timeframes.